Dashboards & reporting
See it live, share it, and report on it.
Dashboards, reports and SLA numbers all read the same metrics and history — one source of truth for the on-call engineer and the monthly review.
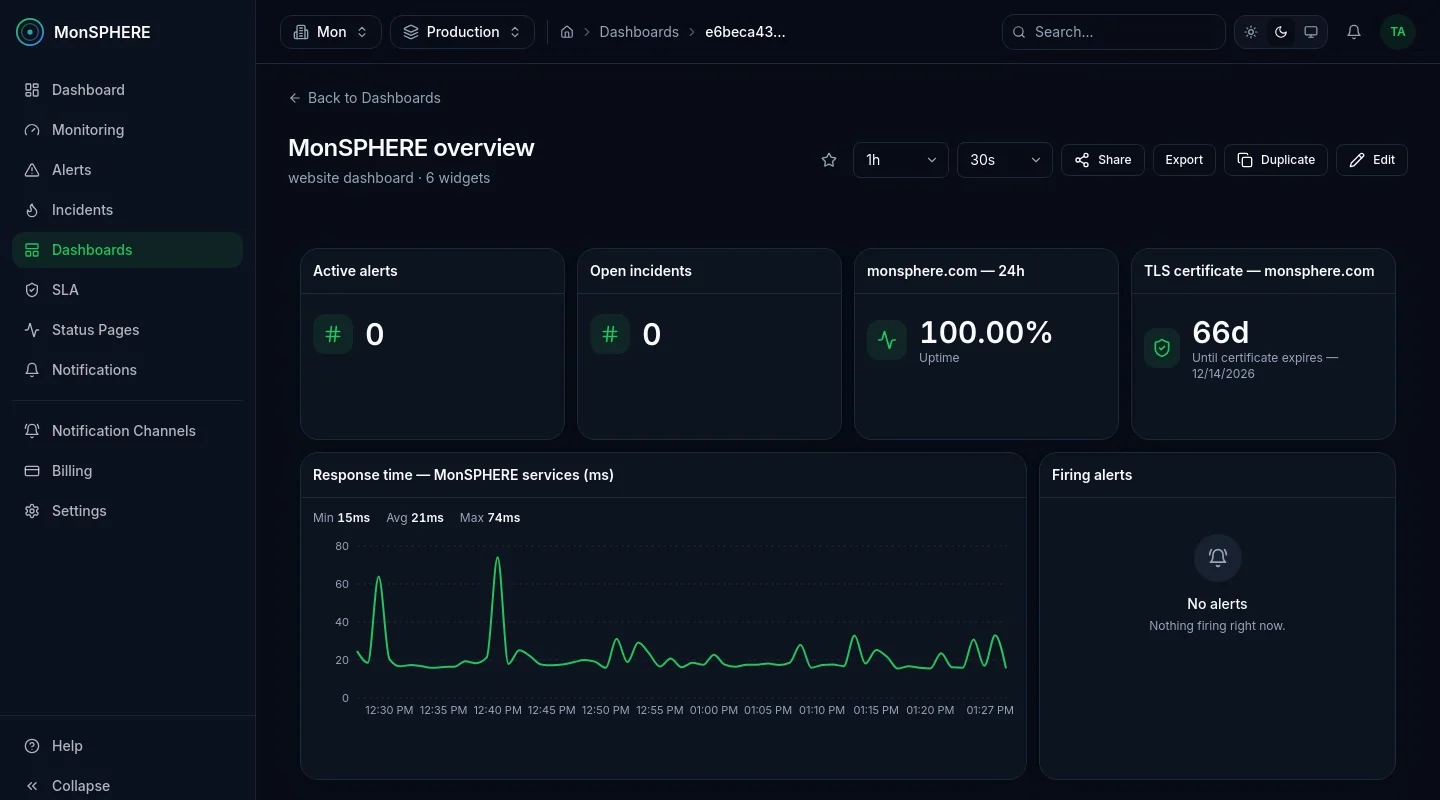
Widget dashboards
Drag-and-drop dashboards from time-series charts, single stats, status grids, tables, certificate expiry, alert and incident lists — each widget backed by a real query.
Public share links
Share a dashboard through a public link with people who don't need a MonSPHERE account.
Reports in four formats
PDF, XLSX, CSV and JSON — uptime percentage, incident count, MTTR and per-monitor breakdowns.
Scheduled or on demand
Schedule a monthly SLA report, or export one ad hoc for a client or a postmortem.
SLA from real history
Uptime is computed from actual check history over the period — never a manually entered target.
Start monitoring everything in minutes
Create a free account, add your first check and get alerted the moment something breaks — no credit card required.