Advanced Website Monitoring
Check what a page or API actually returns — including authenticated endpoints.
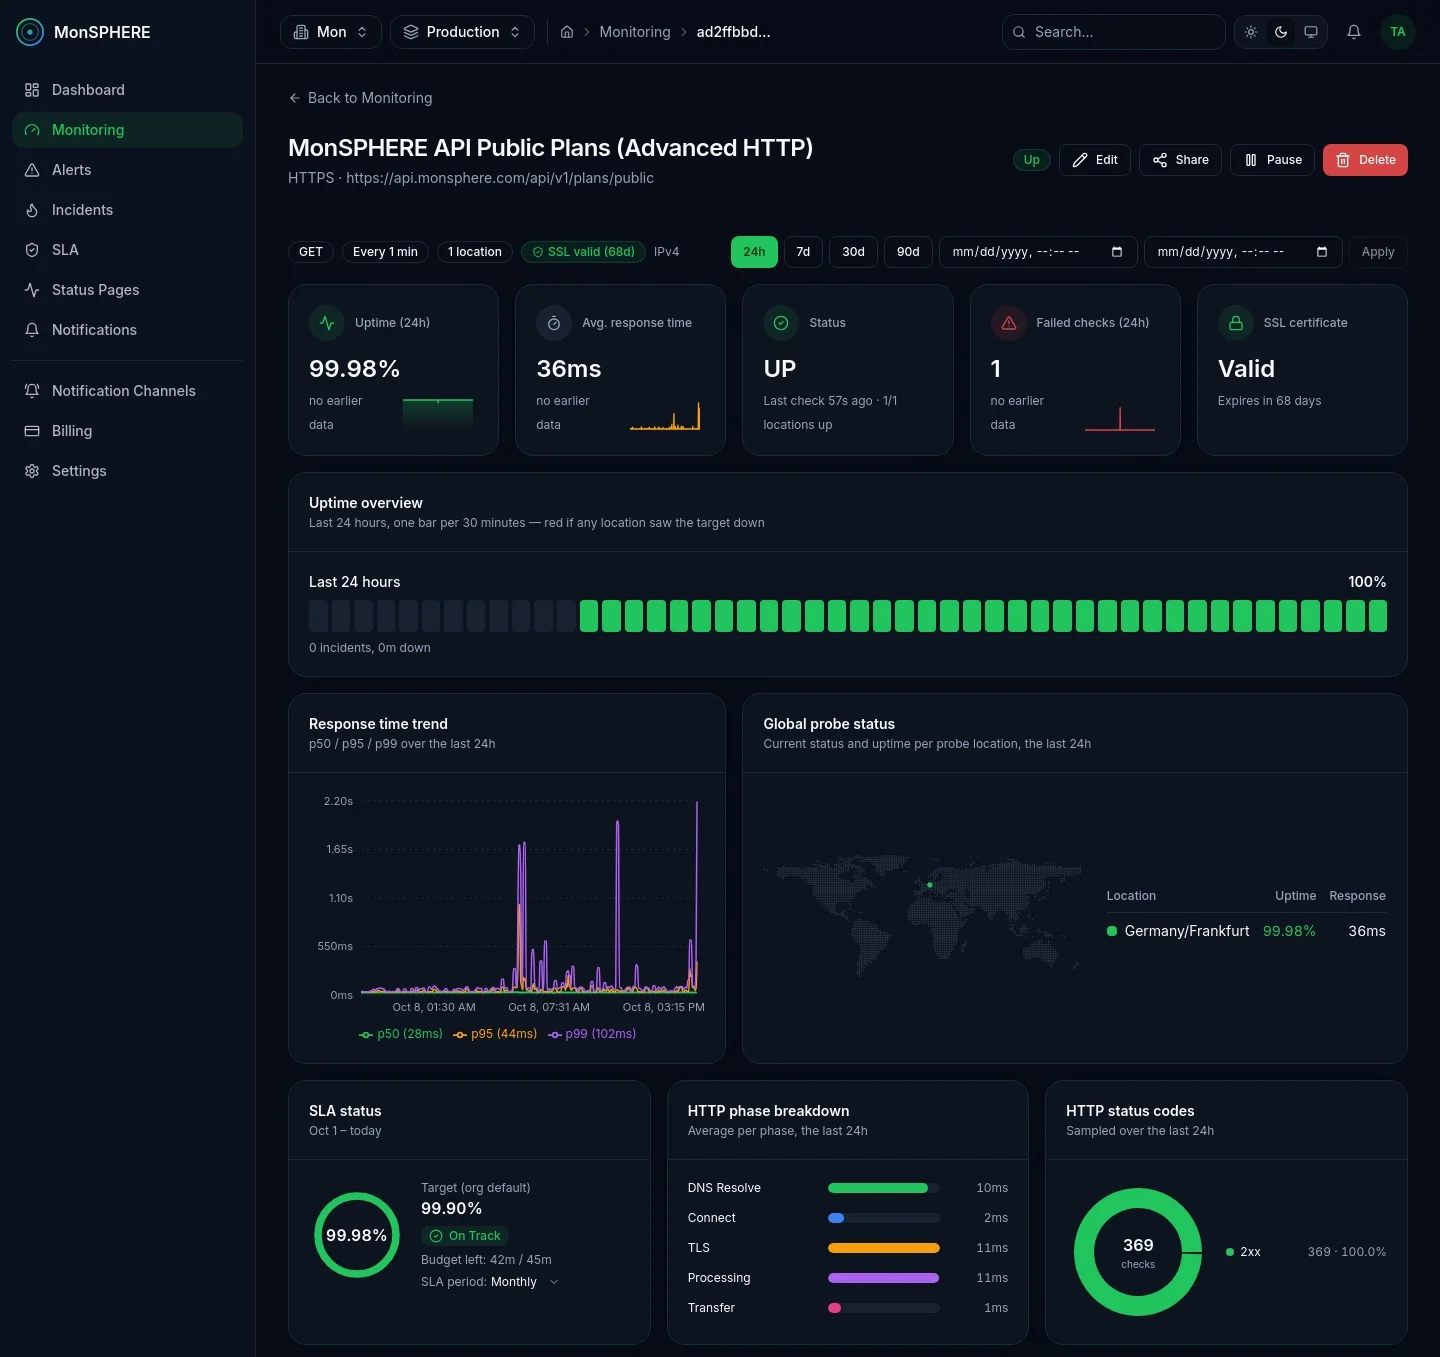
Advanced Website Monitoring adds assertions and request control to every HTTP/HTTPS check: regex and forbidden-keyword checks on the body, assertions on response headers and on values inside a JSON body, and custom request headers and bodies. Use it to catch an error banner on a page that still returns 200, to require a field in an API's JSON answer, or to probe an authenticated API with a token or a payload. When a check fails, a diagnostic check shows which assertion broke and what the service answered.
What it detects
- Content that doesn't match a regular expression you define
- A forbidden string or pattern appearing — an error banner, a maintenance page, a stack trace
- A response header that is missing or wrong — a Content-Type, a security header, a cache policy
- A JSON value that isn't what you expect — a status field, a number past a limit, an item missing from a list
- Authenticated API endpoints failing, using your own Authorization header or API key
- Endpoints that need a POST body or custom headers to answer correctly
How you're alerted
- A failed assertion fails the probe, so the automatically attached “HTTP Down” rule fires.
- A diagnostic check is captured the moment the monitor goes down: every assertion's result, the reason each probe location reported, and the first 2 KB of the response.
- Header and body values are stored encrypted and never returned by the API; the dashboard shows header names only.
Notifications go to any of 8 channels — see notifications.
- Runs from
- Every probe region you assign — down only when all of them agree
- Adds to HTTP/HTTPS
- Regex assertions, forbidden keyword, response header assertions, JSON body assertions, custom headers and body
- JSON assertions
- A path such as data.items[0].status or items[*].status, with equals, not equals, contains, exists, greater than, less than
- Dashboard
- Failure reasons, failures over time, response size trend, which assertion failed and how often, diagnostic check history
- Included in every HTTP check
- Expected status codes, required keyword, Basic Auth, request method
- Available on
- Professional · Enterprise and Custom on request
More in Uptime & APIs
View categoryWebsite Monitoring
Track uptime, response time, and page performance from every region you assign.
Ping Monitoring
ICMP checks for raw network reachability and latency tracking.
TCP Monitoring
Check that a host's port accepts connections, with connect time tracked from every region you assign.
Advanced TCP Monitoring
TCP over TLS plus send/expect validation — confirm a service actually answers correctly, not just that its port is open.
DNS Monitoring
Track DNS resolution and validate that returned records actually match the values you expect — catch a hijacked or silently changed record, not just a resolution failure.
Cron Job Monitoring
Inbound 'I'm alive' checks for cron jobs and background workers — alerts when a run goes missing, with every ping and each run's duration kept.
API Transaction Monitoring
Chain multiple HTTP requests — extract a value from one response, like a login token, and reuse it in the next.
Synthetic Monitoring
Script a real multi-step browser journey — navigate, click, fill, wait, and assert — for user-flow monitoring beyond a simple uptime check.
Start monitoring everything in minutes
Create a free account, add your first check and get alerted the moment something breaks — no credit card required.